Table of Contents
False positive filters
False positive (FP) filters are a second layer of scrutiny which can be automatically applied to chromosomes determined by ADCI to be dicentric. When a dicentric chromosome meets the threshold for a FP filter, it will no longer be classified as dicentric for the purposes of dose estimation and will have a yellow contour in the metaphase image viewer. A set of FP filters are described below and can be activated individually. By default, all FP filters are active.
Issues which may lead to false positives
False positive dicentric chromosomes are assigned to one or more of the following morphological classes:
- Sister chromatid separation (SCS)
- Chromosome fragmentation
- Chromosome overlap
- Noisy contour
- Cellular debris
- Machine learning error
FP filters target one of more of these classes.
Change active false positive filters
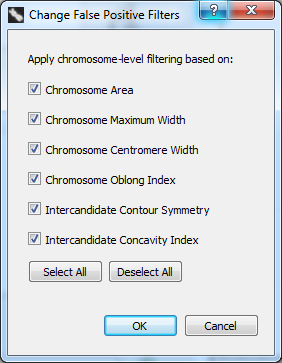
To open the FP filter selection dialog, click “Settings” in the menu bar at the top of the software window and select “Change FP Filters”. The dialog appearing on the right side of the screen will appear. A checkmark beside a filter indicates it is active.

Description of false positive filters
- Chromosome Area
- Targets
Small acrocentric chromosomes (commonly displaying SCS) and chromosome fragments. - Definition
A(c) denotes the pixel area occupied by chromosome c (see Fig 3B). c* was classified as FP if A(c*)/median({A(c1),…,A(cN)}) < 0.74 or as TP otherwise.
- Chromosome Maximum Width
- Targets
SCS and chromosome fragments. - Definition
Wmax(c) denotes the maximum value of the width profile of chromosome c (see Fig. 3C). c* was classified as FP if Wmax(c*)/median({Wmax(c1),…,Wmax(cN)}) < 0.83 or as TP otherwise.
- Chromosome Centromere Width
- Targets
SCS and chromosome fragments. - Definition
Wcent(c) denotes the width of chromosome c at the top-ranked centromere candidate (see Fig. 3C). c* was classified as FP if Wcent(c*)/median({Wcent(c1),…,Wcent(cN)}) < 0.72 or as TP otherwise.
- Chromosome Oblong Index
- Targets
Acrocentric chromosomes with SCS and some cases of overlapping chromosomes. - Definition
S(c) denotes the pair of side lengths of the minimum bounding rectangle enclosing the contour of chromosome c (see Fig. 3D). c* was classified as FP if 1 − min(S(c*))/max(S(c*)) < 0.28 or as TP otherwise.
- Intercandidate Contour Symmetry
- Targets
SCS and some cases of overlapping chromosomes. - Definition
LC(c) denotes the pair of arc lengths of the contour regions of chromosome c that run between the traceline endpoints of its top 2 centromere candidates (see Fig. 3F). c* was classified as FP if min(LC(c*))/max(LC(c*)) < 0.42 or as TP otherwise.
- Intercandidate Concavity Index
- Targets
Prometaphase chromosomes. - Definition
W’ denotes the first derivative of the width profile between the top 2 centromere candidates, wmean denotes the mean value of the width profile between the top 2 centromere candidates, wmax-centromere denotes the larger of the two width profile values at the top 2 centromere candidates. c* was classified as FP if (wmean – wmax-centromere) / mean(abs(W’)) < 0.78 or as TP otherwise.
Decipher FP Flag value
When a sample is highlighted within the main GUI a “FP Flag” field is visible. This is a decimal number which encodes which FP filters are active through the use of “bit flags”. A FP Flag value of 0 indicates no FP filters are active. For other FP Flag values, the decimal number must be converted to binary to decipher which FP filters are active.
These calculations are unnecessary if the goal is simply to determine which FP filters are active while ADCI is running. Active filters are displayed in the “Change FP Filters” dialog discussed above. Deciphering FP filters based on the FP Flag may be necessary if console output is saved and viewed at a later date. If active FP filters have been forgotten during that time, the FP Flag present in the console output can be used to recover them.
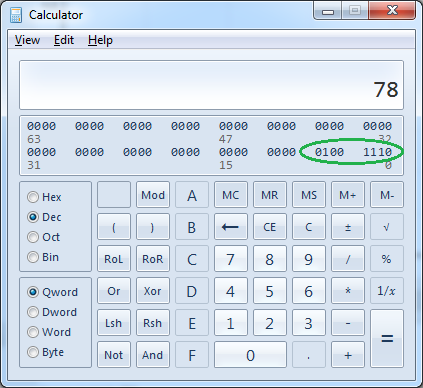
Many online tools exist to convert a decimal to binary such as this Decimal to Binary Converter. Simply input the “FP Flag” value and click “Convert”. The Windows built-in calculator can also perform this conversion by selecting “View” → “Programmer”, then selecting “Dec” using the radio button.
In this example, a FP Flag of 78 was shown after highlighting a sample in the main GUI. In binary the decimal number 78 is equivalent to 01001110. Make note of the position of each “1” reading from right to left. In this case, the positions are 2, 3, 4, and 7. Then refer to the list below to discover which FP filter each digit corresponds to. Thus, if the FP Flag is 78, the Chromosome Area, Chromosome Maximum Width, Chromosome Centromere Width, and Intercandidate Concavity Index filters are active.
87654321 - Position. Corresponds to the list of filters directly below.
01001110 - Binary digits.
The 8 bits of interest are as follows:
- Empty (There is no filter at this position, the binary digit will always be 0)
- Chromosome Area
- Chromosome Maximum Width
- Chromosome Centromere Width
- Intercandidate Contour Symmetry
- Chromosome Oblong Index
- Intercandidate Concavity Index
- Empty (There is no filter at this position, the binary digit will always be 0)

