main:samplereport
Table of Contents
Sample report
Content
A sample report contains the following content:
- Table of contents
- General overview of samples
- Dicentric distribution related plots and tables
- Filtering stats related plots and tables
Creation
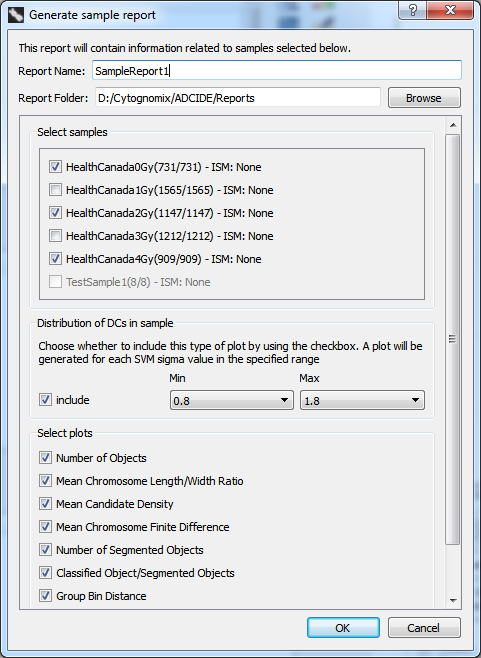
To open the sample report generation dialog, click “Report” in the menu bar at the top of the software window and select “Generate sample report”.
- Specify a name for the report
A name for this report. A report directory containing images and an report.html file will be created automatically using this name. - Select samples
Include processed samples in the report by placing a checkmark beside appropriate samples in the “Select samples” list. Selection of one or more samples is required. Unprocessed samples are displayed but the checkbox is disabled. - Specify SVM sigma value range
Specify a range of SVM sigma values for which to generate DC distribution plots by selecting values in ‘Min’ and ‘Max’ dropdown boxes within the “Distribution of DCs in sample” area. Exclude DC distribution plots from the report if desired by unchecking the ‘include’ checkbox in the ‘Distribution of DCs in sample’ area. - Select plots containing filtering stats Include specific filtering stats plots in the report by placing checkmarks beside appropriate plots in the ‘Select plots’ area.
- Click “OK” to begin report generation
The report will open automatically in several seconds. It is also automatically saved as an HTML file located in the “Report Folder”/“Report Name” directory specified during report generation. Open the file “Report.html” to view the report. For more information about the location of saved reports consult the reports page.

main/samplereport.txt · Last modified: 2017/03/06 19:06 by bshirley
