Table of Contents
FAQ, tips and tricks
This page answers frequently asked questions and provides some useful tips and tricks in ADCI.
FAQ
What does it mean when the software says "some DC frequencies have poor quality. Do you want to continue?"
This warning will appear during calibration curve generation or dose estimation if samples do not meet quality control thresholds. These thresholds are explained in the quality control page and can also be customized. When such a warning happens, users are encouraged to review their metaphase image data to see if there are excessive images of poor quality. If users are confident about their data or no better data can be obtained, users can ignore this warning.
Can I change the name of a saved sample file or the ID of a sample in ADCI
The ID of a sample is given by users when the sample is created. It cannot be changed after initialization. ADCI uses sample IDs to find contour files for samples and to reference samples in reports. The filenames of sample files (*.adcisample) can be changed arbitrarily. Changing its filename does not affect the sample ID saved in the file. When users are saving a sample to a file, ADCI will use the ID as the default filename.
Is there a way to view the optimal image selection models after it has been saved in the optimal model search and the search dialogue is closed
Yes. Users can specify the destination folder when they are saving a optimal image selection model found in the search. By default, it will be the same folder of the preset models. Such models can be viewed in the same way as preset models, which is demonstrated in this page. If the optimal models are saved in a different folder, they need to be moved to the folder of preset models to be viewed.
Is it necessary to keep image files associated with a sample stored on my computer after the sample has been processed
The presence of image files is not required for any processed sample operations with the exception of viewing images in the metaphase image viewer. Operations such as dose estimation, calibration curve generation, report generation, etc. can all be performed if sample images are no longer present. If it is not necessary to view sample images in the metaphase image viewer, the images may be freely moved to another location or removed. This may be desirable due to the large amount of disk space some sets of images require. It is also possible to process a sample directly from an external drive without first copying images to a local drive. However, if this method is used, please note that images cannot be viewed in the metaphase image viewer when the external drive is disconnected.
Should I use wizards for calibration curve generation and dose estimation or is it better to enter values manually
In almost all circumstances, it is preferable to use the calibration curve wizard when generating a calibration curve and the dose estimation wizard to perform dose estimation. We recommend exclusively using the wizards when using ADCI for the first time, then after you have become more familiar with ADCI functionality to manually enter values when/if specific functionality is required which the wizard cannot provide. Using wizards remove several potential sources of error such as the application of the appropriate image selection model during dose estimation.
Does ADCI require TIF images
TIF images are preferred. We have also worked with jpeg images, however they exhibit loss of resolution due to their compression algorithm. The ADCI sample process time page shows the difference in resolution and speed of processing. The jpeg images are labelled 912×732 pixels in this page. Supported image formats are also discussed on the sample page under the heading “Supported image formats”.
How many images should I prepare for each dose point
The most important thing about the images is that they should contain exclusively or primarily metaphase cells. ADCI will process images that don't have metaphases, but these reduce the speed of processing and image selection, and can affect the image selection criteria. Typically, more images (several thousand) are required at low dose than at high dose (500-1000). The system provides a warning about sample quality if there are fewer than 100 dicentric chromosomes detected in a sample (these are the criteria in the IAEA manual). This means that for calibration samples, 2000-3000 images will provide good confidence intervals. But it all depends on the quality of your data. If many images contain a lot of sister chromatid separation, then ADCI needs more images to find those images that show strong cohesion between chromatids.
Can I continue to use curves/samples generated using an older version of ADCI after upgrading to a new version
It is important to note dicentric detection may vary across ADCI versions. Reasons for this variation include dicentric detection algorithm upgrades and software bug fixes. It is therefore recommended to analyse both calibration and test samples using the same version of ADCI.
Useful tips and tricks
Create a calibration curve using multiple samples of the same dose
This is possible to do, but it does require the use of a “workaround”. While generating a calibration curve, duplicate dose values are disallowed. The “validate” button on the “Fit a curve” dialog will turn duplicate dose values red, thus preventing the completion of the dialog. To work around this, the dose values of duplicate samples can be changed to a value very close to - but not identical to - its original value. For example if you would like to create a calibration curve containing two samples at 3Gy, one sample can keep its dose value of 3 and the other can be changed to 3.0001. However, do not enter more than 7 digits after the decimal point in the new dose. ADCI will no longer flag the dose values as duplicated.
View outlier images
Quality statistics of a sample can be visualized in the plot display. Some outlier images may be present when viewing certain plots. It may be useful to view these outlier images, especially to review the quality of the image. The metaphase image viewer in ADCI can sort images in a variety of different orders allowing users to find outlier images easily.
The dropdown box at the top-right corner of the metaphase image viewer can be used to change the order of images based on certain criteria, one such ordering is by object count. However, if images must be sorted by length-width ratio, candidate density or finite difference, the following trick is needed.
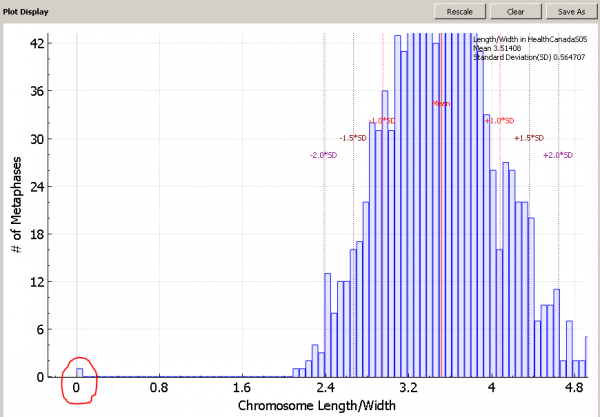
For example, when we look the length-width ratio histogram of the sample below, we can see a leftmost bin containing only one image is far away from other bins. We want to sort images in the sample in the order of length-width ratio to see the outlier image.

Go to metaphase viewer and click the button labelled 'Apply Image Filter'. We will make a temporary selection model to rank images in the order of length-width ratio.
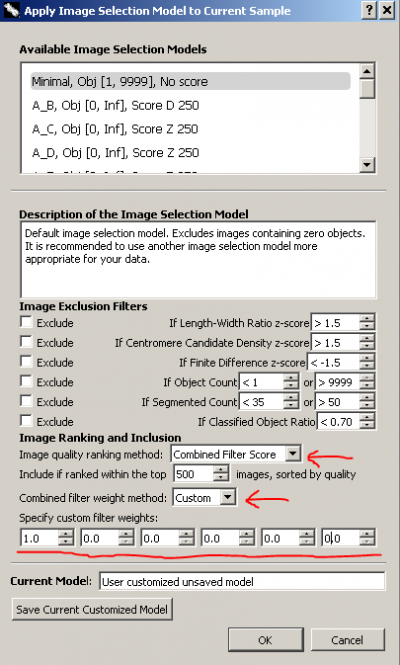
In the image selection model dialogue, keep all 'Image Exclusion Filters' unchecked. Choose 'Combined Filter Score' for 'Image quality ranking method'. Choose 'Custom' for 'Combined filter weight method'. Since we are only interested in length-width ratio, we set its weight, the first weight, to be 1 and all other weights to be 0. The weight for length-width ratio can be any positive non-zero value. We use 1 just for convenience. The weights are in the same order of the filters listed in the dialogue, in case you forget. In this way, images in the sample will be scored and ranked solely by length-width ratio. We do not need to change the number of included top images.
Our final temporary image selection model should look like the figure on the right. We do not want to save the model. Simply click 'OK' to apply it. Similarly, images can be scored and ranked only by candidate density or finite difference.
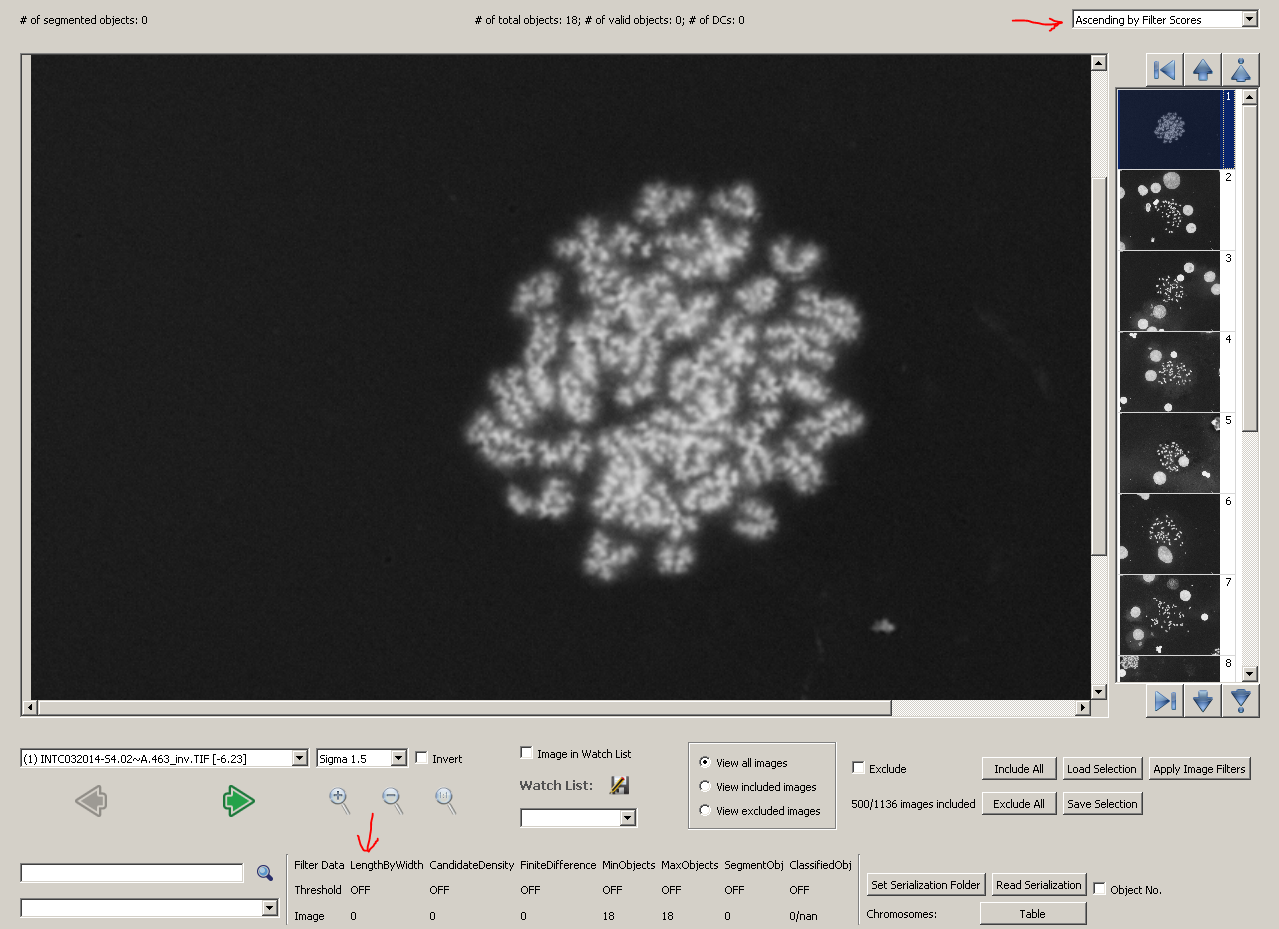
After applying the model, choose 'Ascending by Filter Scores' in the top-right dropdown box in metaphase viewer. Images will be sorted by their filter scores, which are calculated using length-width ratio exclusively.

The first image we see, which is the outlier in the histogram, is a poor-quality image without any object segmented. If you have the development mode enabled, the statistical values of the image will be listed in the bottom part of metaphase viewer. For this image, its length-width ratio is 0, as no chromosome object is found. The result is showed in the figure below.

