Table of Contents
Estimate dose
For most purposes, the end goal of ADCI software is to provide the estimated radiation dose (in Gy) of test samples. In order to generate the estimated dose, processed samples and a calibration curve must be present. Alternatively, dose estimation can also be performed on dicentric frequency alone without the presence of a curve.
When performing dose estimation, it is generally preferable to use the dose estimation wizard instead of manually importing/entering values as described on this page. The wizard seamlessly prompts you to select a calibration curve and processed samples and applies the same image selection model to the samples that was used when generating the curve. However, to examine dicentric frequency alone without the presence of a curve, the dose estimation wizard cannot be used and a method to do so is described below.
Dose calculator
The dose estimation wizard guides the user through the necessary steps to estimate the dose of a set of processed samples. While using the wizard the sample name, SVM sigma value, and dicentric frequency are automatically prepopulated based on the selected samples. The steps within the wizard can also be performed manually if desired, those steps are described below.
Open dose calculator
Whether dicentric frequencies are to be entered manually or by examining existing processed samples, a calibration curve is necessary for dose estimation. Highlight the appropriate calibration curve within the list of curves in the main GUI and click the ![]() icon.
icon.
Use dicentric frequency from existing sample
- Information about selected calibration curve
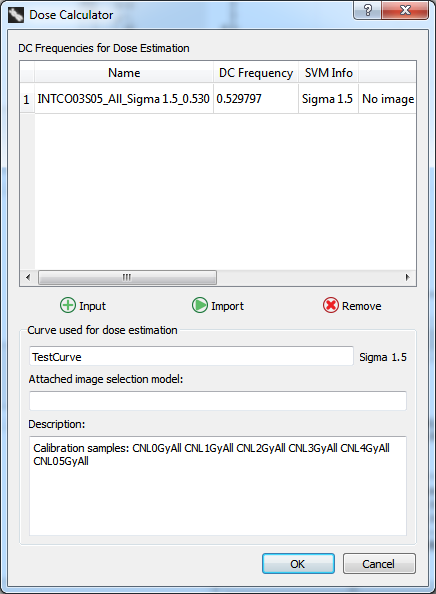
The curve ID and SVM sigma value of the highlighted curve is listed under the heading “Curve used for dose estimation”. Ensure the correct curve has been selected. - Add a sample to DC Aberrations for Dose Estimation list
To populate the list based on one or more processed samples, click “Import”, highlight the appropriate test samples, and choose an SVM Sigma value (see below). - Select SVM Sigma value
When samples are added to the “DC Aberrations for Dose Estimation” list an SVM sigma value must be chosen. It is highly recommended to choose the same SVM sigma value used to create the selected calibration curve found at the bottom of the dialog.
Dicentric chromosome counts are influenced by the SVM sigma value. If overall dicentric chromosome counts within test samples and calibration samples are made based on different SVM sigma values, the results may not be as accurate.
- Add additional samples if necessary
The above two steps can be repeated to add additional samples. Note you can add multiple samples at the same time by highlighting multiple samples in the “Import Sample(s) from WorkSpace” dialog which appears after clicking “Import”. - Remove samples if necessary
To remove a sample from the “DC Aberrations for Dose Estimation” list, highlight the appropriate samples to be removed and click “Remove”. - Click “OK” to finish
Dose estimation results can now be found in the console. Additionally, the plot display is updated to show a visual representation of the dose estimate(s).

Manually enter dicentric frequency
It is not recommended to manually enter DC frequency values for dose estimation when using a calibration curve generated by ADCI software. If the curve coefficients have been entered manually then it is permissible to manually enter DC frequency values as well. If the curve was generated using ADCI software it has an associated SVM sigma value (as seen at the bottom of the dialog). Higher SVM sigma values find more DCs than lower SVM sigma values but still generally underestimate DC counts when compared to expert manual examination1). Manual counts of DCs are of course not associated with any SVM sigma value. Therefore, manually entering DC counts and using a curve generated using an SVM sigma value will not generate results accurately.
- Information about selected calibration curve
The curve ID and SVM sigma value of the highlighted curve is listed under the heading “Curve used for dose estimation”. Ensure the correct curve has been selected. - Manually add values to DC Aberrations for Dose Estimation list
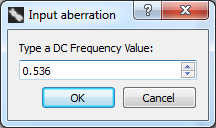
To populate the list manually, click the “Input” dicentric frequency in the popup dialog. - Add additional DC frequencies if necessary
The above step can be repeated to add additional DC frequencies. - Assign names to manually entered DC frequencies
Names can be assigned to manually entered DC frequencies by double clicking on the appropriate “Name” field within the “DC Aberrations for Dose Estimation” list. Naming entries is helpful if multiple entries are present as dose estimation results are labelled by name. - Remove samples if necessary
To remove a sample from the “DC Aberrations for Dose Estimation” list, highlight the appropriate samples to be removed and click “Remove”. - Click “OK” to finish
Dose estimation results can now be found in the console. Additionally, the plot display is updated to show a visual representation of the dose estimate(s).


Interpret dose estimation results
Dose estimation results are found in the console area within the main GUI. An Example result is shown below.

Standard fields found in dose estimation results
- Aberration
Name of the sample or manually entered DC frequency. In the case of a sample, additional information is appended to the name in the format “_[selectedsigma]_[DC frequency]” - DC Frequency
The DC frequency found within the sample at the specified SVM Sigma value. If DC frequency was entered manually, the same DC frequency will be output here. - SVM Sigma
SVM Sigma value selected within the Dose Calculator chosen for the sample. If DC frequency was entered manually there is no associated SVM sigma value, in this case the SVM Sigma field reads “NA”. - Dose by [curvename]
[curvename] is the name of the calibration curve used for dose estimation assigned when it was created. The contents of this field is the estimated radiation exposure of the sample (or manually entered DC frequency) in Gy.
Confidence intervals
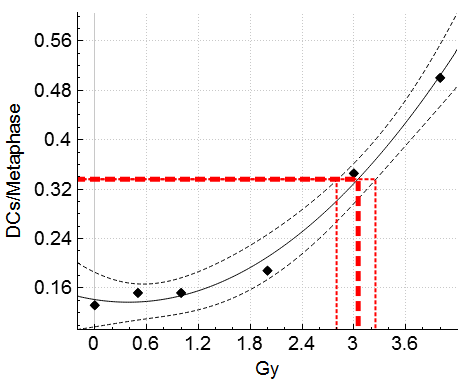
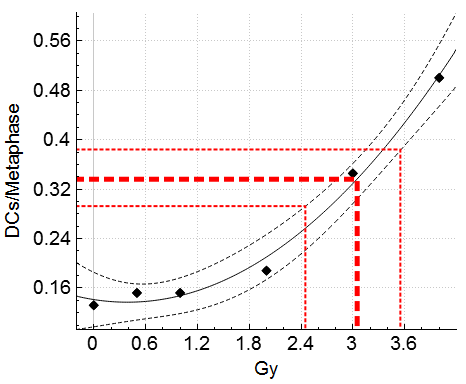
Two factors which contribute to uncertainty present in dose estimation are the Poisson nature of dicentric chromosome yield and uncertainties related to the calibration curve. These types of uncertainty are taken into account based on settings within [Settings (menu bar) → Statistics Options]. Dose estimate upper confidence limits (UCL) and lower confidence limits (LCL) are shown on the dose estimation plot as smaller dotted lines. The LCL of a dose estimate is always greater than or equal to 0. The UCL of a dose estimate will always be less than the upper bound of the curve or LCL of the curve when curve confidence intervals are taken into account. If the UCL of a dose estimate is above this value, it will be listed as “out of bounds” in the console.
Uncertainty based on the Poisson nature of dicentric yield
Calculates the exact 95% confidence interval of the Poisson distribution, resulting in upper and lower bounds of DC frequency. DC frequency upper bound is intersected with the calibration curve to calculate dose estimate UCL. DC frequency lower bound is intersected with the calibration curve to calculate dose estimate LCL.

Uncertainty based on the calibration curve
Confidence intervals of the curve are used to calculate a dose estimate range. The DC frequency reading is intersected with the calibration curve UCL and LCL to generate the dose estimate LCL and UCL respectively. Note a dicentric frequency may never intersect the lower limit of the calibration curve within a specified upper limit of the curve, even if it does intersect the calibration curve. If they do not intersect, the UCL is listed as out of bounds.

Uncertainty based on both Poisson and curve
First calculates the exact 95% confidence interval of the Poisson distribution, resulting in upper and lower bounds of DC frequency. The lower bound of DC frequency is intersected with the calibration curve UCL to obtain the dose estimate LCL. Similarly, the upper bound of DC frequency is intersected with the calibration curve LCL to obtain the dose estimate UCL. Note a dicentric frequency may never intersect the lower limit of the calibration curve within a specified upper limit of the curve, even if it does intersect the calibration curve. If they do not intersect, the UCL is listed as out of bounds.

